ABSTRACT
We apply global waveform tomography to model radial anisotropy in the whole mantle. We find that in the last few hundred kilometers near the core mantle boundary, horizontally polarized S wave velocities VSH are, on average, faster (~1%) than vertically polarized S velocities (VSV), suggesting a large scale predominance of horizontal shear. This confirms that the D" region at the base of the mantle is also a mechanical boundary layer for mantle convection. A notable exception to this average signature can be found at the base of the two broad low velocity regions under the Pacific Ocean and under Africa, often referred to as "superplumes", where the anisotropic pattern indicates the onset of vertical flow.
Model parametrization:
The model is parametrized laterally in spherical harmonics and radially
in 16 unevenly spaced splines
with the same distribution as in SAW24B16.
The model is parameterized in terms of isotropic S velocity (up to a
maximum spherical harmonic degree of 16) and up to degree 8 in xi, a parameter
measuring shear anisotropy defined by (xi=VSH2/VSV2).
|
|
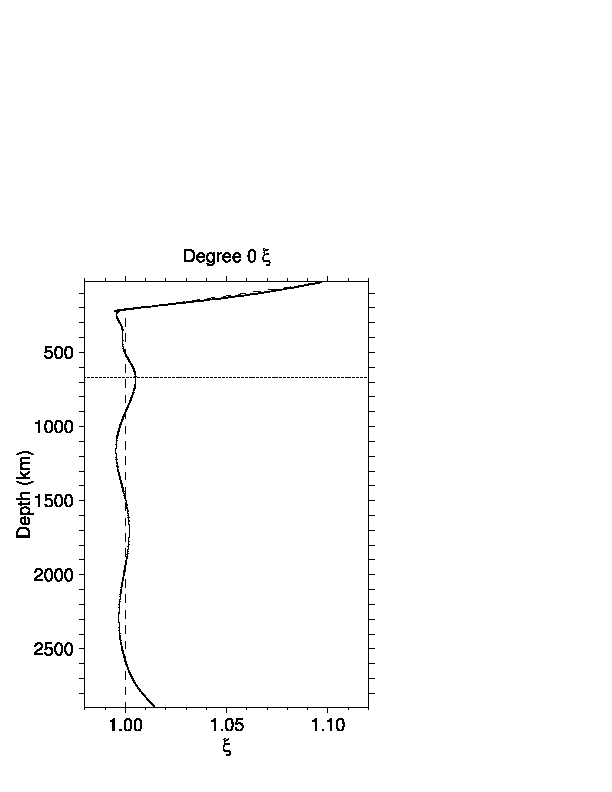
| Degree 0 model for xi as a function of depth (solid line).The values for PREM are shown by the dashed line. For reference,the 660-km discontinuity in the transition zone between the upper and lower mantle is shown (dotted line).Note the strong increase at the base of the mantle, similar but smaller in amplitude to that seen in the uppermost mantle. |

|
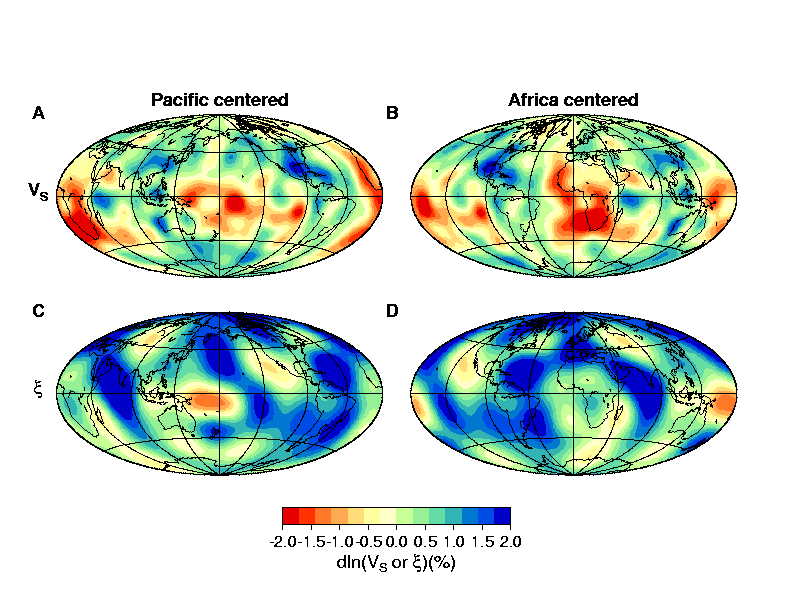
| Distribution of ln(VS ) (A
and B) and ln(xi) (C and D) at a depth of 2800 km.Maps are shown centered
under the Pacific (A and C) and Africa (B and D). |