ABSTRACT The Earth undergoes continuous oscillations, and free oscillation peaks have been consistently identified in seismic records in the frequency range 2-7 mHz, on days without significant earthquakes. The level of daily excitation of this 'hum' is equivalent to that of magnitude 5.75 to 6.0 earthquakes, which cannot be explained by summing the contributions of small earthquakes. As slow or silent earthquakes have been ruled out as a source for the hum (except in a few isolated cases), turbulent motions in the atmosphere or processes in the oceans have been invoked as the excitation mechanism. We have developed an array-based method to detect and locate sources of the excitation of the hum. Our results demonstrate that the Earth's hum originates mainly in the northern Pacific Ocean during Northern Hemispheric winter, and in the Southern oceans during Southern Hemispheric winter. We conclude that the Earth's hum is generated by the interaction between atmosphere, ocean and sea floor, problably through the conversion of storm energy to oceanic infragravity waves that interact with seafloor topography.
Download pdf supplementary material
Listen to the 'hum' created by Terrence Averkamp based on our measurment
BBC
News : Science pinpoints Earth's 'Hum'
Guardian
: Scientists rumble Earth's hum
CBC
News : Winter stroms source of Earth's hum: geologists
The
Herald : Reveald: secret of the deep on why the world is humming
Science News : Humming Along: Ocean waves may cause global seismic noise
NewScientist : Earth's 'hum' springs from stormy seas
Der Spiegel : Warum der Meeresboden singt
Frankfurter Allgemeine Zeitung, 29.11.2004, Nr. 279, S. 34
For all enquiries, please contact Junkee Rhie: ![]() rhie@seismo.berkeley.edu
rhie@seismo.berkeley.edu
or Barbara Romanowicz ![]() rhie@seismo.berkeley.edu
rhie@seismo.berkeley.edu
|
|
|
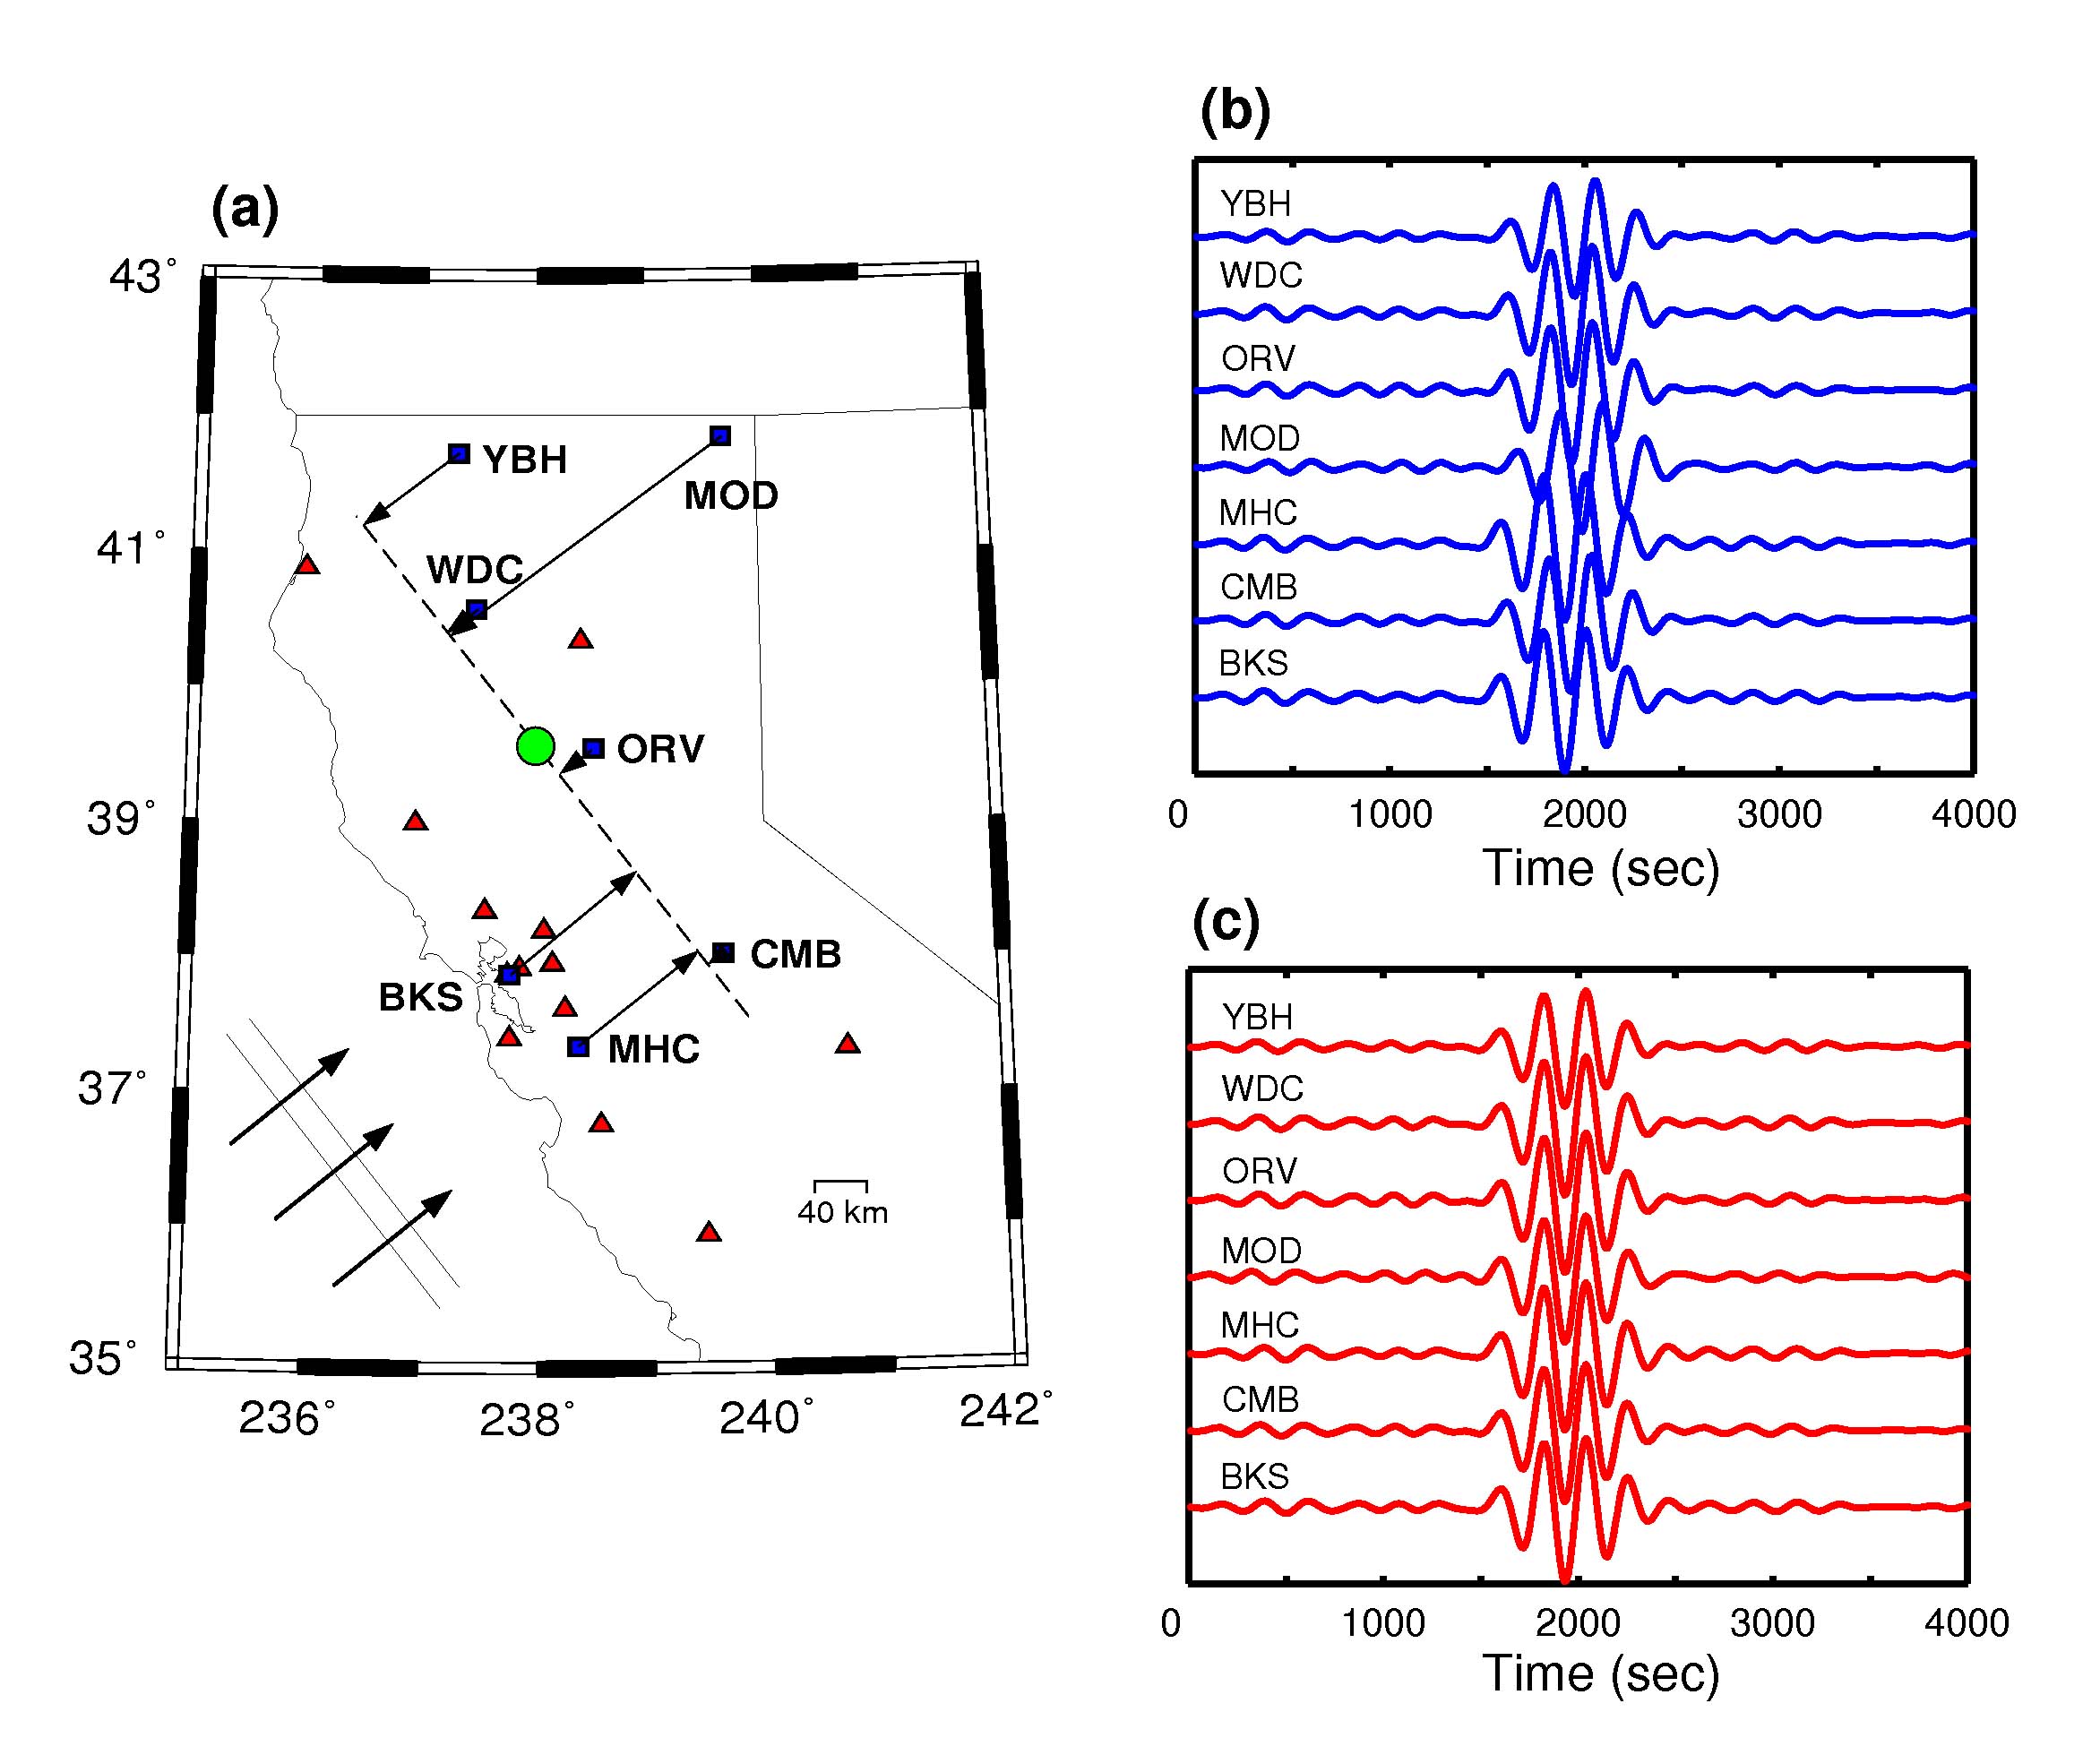
Illustration of stacking proceduer. (a) Schematic diagram showing how waveforms are mapped to the center of the array, here the Berkeley Digital Seismic Network (BDSN), assuming plane wave propagation. Symbols indicate quite BDSN stations used in this study (blue squares), other BDSN stations (red triangles) and center of the array (green solid circle). (b) Vertical velocity waveforms generated by the Jan. 8, 2000 Mw 7.2 event at 7 quiet BDSN stations. Waveforms are filtered using a Gaussian filter centered at 240 sec; (c) same as (b) after back-projecting the waveforms to the center of the array, correcting fordispersion and attenuation using the reference PREM model, and the known back-azimuth of the event. |
|
|
|
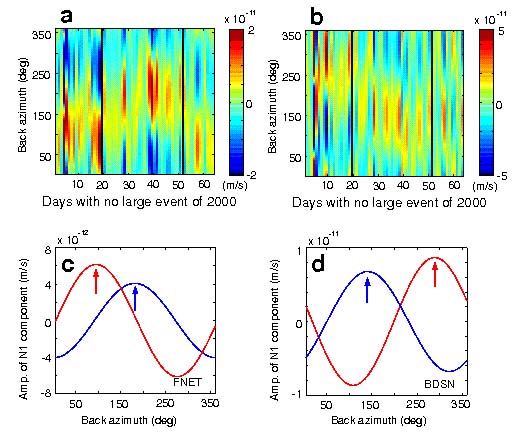
Amplitude of stacks as a function of tiem and back azimuth for quiet days in 2000. (a) Variation as a function of time of the back-azimuth corresponding to the maximum in the degree 1 component of stacdk amplitude for F-net. Black vertical lines seperate winter and sumer intervals. (b) same as (a) for BDSN. (c) Degree 1 in the Fourier decomposition of average stack amplitude as a function of azimuth for F-net, for the winter (red) and the summer (blue). (d) same as (c) for BDSN. |
 |
|
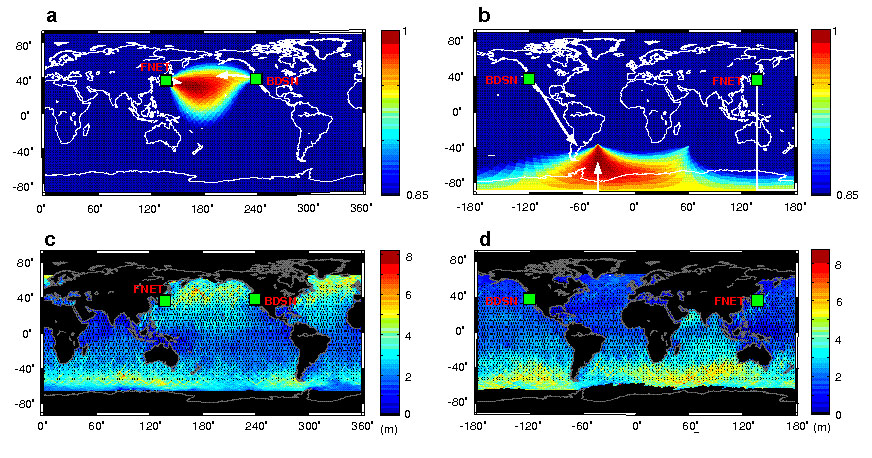
Comparison of seasonal variations in the distribution of hum related noise and significant wave height in the year 2000. The directions corresponding to mean amplitues that are larger than 85% of the maximum in the degree 1 component are combined for the two arrays in winter (a) and in summer (b) to obtain the region of predominant sources in each season. Global distribution of significant wave height, in the winter (c) and in the summer (d), averaged from TOPEX/Poseidon images for the months of January and July, 2000, respectively (wave height in meters). Significant wave height gives a measure of ocean storm activity. |